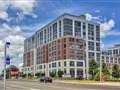
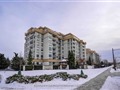
11121 Yonge St 223
$590,346
Comparative Market Analysis
Apr 23, 2024
NOT AN ACTIVE LISTING
Historical Performance
| Period | $ Change | % Change |
| 1 Day | +$380 | +0.064% |
| 7 Days | +$328 | +0.056% |
| 30 Days | +$333 | +0.057% |
| 3 Months | -$755 | -0.128% |
| 6 Months | +$7,928 | +1.36% |
| 1 Year | -$26.5k | -4.30% |
| 3 Years | +$105k | +21.6% |
| 5 Years | +$178k | +43.1% |
| 10 Years | +$322k | +120% |
List My Property
Real Estate Statistics
Financing Solutions
AS SEEN ON


Are You a Licensed Real Estate Agent or Broker?