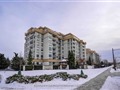
11121 Yonge St 419
$614,645
Comparative Market Analysis
May 7, 2024
NOT AN ACTIVE LISTING
Historical Performance
| Period | $ Change | % Change |
| 1 Day | +$395 | +0.064% |
| 7 Days | +$375 | +0.061% |
| 30 Days | +$512 | +0.083% |
| 3 Months | -$265 | -0.043% |
| 6 Months | +$9,290 | +1.53% |
| 1 Year | -$25.4k | -3.97% |
| 3 Years | +$116k | +23.3% |
| 5 Years | +$202k | +49.0% |
| 10 Years | +$349k | +131% |
List My Property
Real Estate Statistics
Financing Solutions
AS SEEN ON


Are You a Licensed Real Estate Agent or Broker?