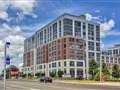
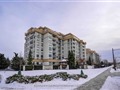
11121 Yonge St 421
$525,221
Comparative Market Analysis
Apr 20, 2024
NOT AN ACTIVE LISTING
Historical Performance
| Period | $ Change | % Change |
| 1 Day | +$338 | +0.064% |
| 7 Days | +$272 | +0.052% |
| 30 Days | +$198 | +0.038% |
| 3 Months | -$1,000 | -0.190% |
| 6 Months | +$6,342 | +1.22% |
| 1 Year | -$25.3k | -4.60% |
| 3 Years | +$87.1k | +19.9% |
| 5 Years | +$149k | +39.6% |
| 10 Years | +$306k | +139% |
List My Property
Real Estate Statistics
Financing Solutions
AS SEEN ON


Are You a Licensed Real Estate Agent or Broker?