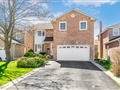
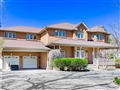
39 Scott Dr
$2,853,062
Comparative Market Analysis
May 1, 2024
NOT AN ACTIVE LISTING
Historical Performance
| Period | $ Change | % Change |
| 1 Day | +$561 | +0.020% |
| 7 Days | -$330 | -0.012% |
| 30 Days | -$6,792 | -0.237% |
| 3 Months | -$9,734 | -0.340% |
| 6 Months | +$48.5k | +1.73% |
| 1 Year | -$132k | -4.41% |
| 3 Years | +$391k | +15.9% |
| 5 Years | +$542k | +23.4% |
| 10 Years | +$1.52m | +114% |
List My Property
Real Estate Statistics
Financing Solutions
AS SEEN ON


Are You a Licensed Real Estate Agent or Broker?