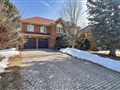
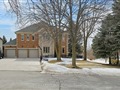
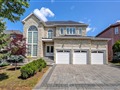
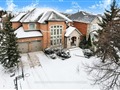
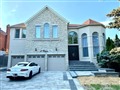
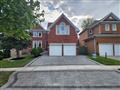
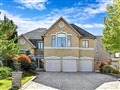
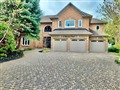
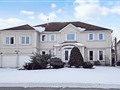
50 Farnham Dr
$2,664,262
Comparative Market Analysis
Jun 14, 2025
NOT AN ACTIVE LISTING
Historical Performance
| Period | $ Change | % Change |
| 1 Day | +$496 | +0.019% |
| 7 Days | -$321 | -0.012% |
| 30 Days | -$6,164 | -0.231% |
| 3 Months | -$8,309 | -0.311% |
| 6 Months | +$46.5k | +1.78% |
| 1 Year | -$123k | -4.43% |
| 3 Years | +$441k | +19.8% |
| 5 Years | +$684k | +34.6% |
| 10 Years | +$1.45m | +119% |
List My Property
Real Estate Statistics
Financing Solutions
Browsing History
32 Nappa St, Richmond Hill
1 second ago
122A Clarendon Dr, Richmond Hill
1 second ago
19 Eastgate Cres, Richmond Hill
2 seconds ago
23 Farnham Dr, Richmond Hill
2 seconds ago
31 Farnham Dr, Richmond Hill
2 seconds ago
19 Alessia Crt, Richmond Hill
2 seconds ago
AS SEEN ON

Are You a Licensed Real Estate Agent or Broker?