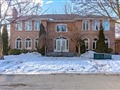
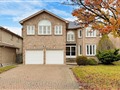
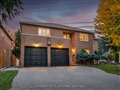
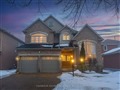
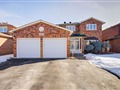
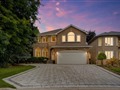
53 Red Oak Dr
$1,874,084
Comparative Market Analysis
Jul 10, 2025
NOT AN ACTIVE LISTING
Historical Performance
| Period | $ Change | % Change |
| 1 Day | +$410 | +0.022% |
| 7 Days | -$97 | -0.005% |
| 30 Days | -$4,304 | -0.229% |
| 3 Months | -$6,758 | -0.359% |
| 6 Months | +$29.9k | +1.62% |
| 1 Year | -$91.8k | -4.67% |
| 3 Years | +$337k | +21.9% |
| 5 Years | +$395k | +26.7% |
| 10 Years | +$1.05m | +128% |
List My Property
Real Estate Statistics
Financing Solutions
Browsing History
47 Meadowcliffe Ave, Richmond Hill
1 second ago
35 Rawlings Ave, Richmond Hill
1 second ago
39 Oneida Cres 1218, Richmond Hill
1 second ago
106 Pine Bough Manr, Richmond Hill
2 seconds ago
65 Oneida Cres 1908, Richmond Hill
2 seconds ago
AS SEEN ON


Are You a Licensed Real Estate Agent or Broker?