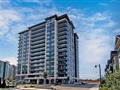
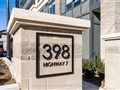
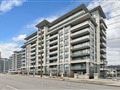
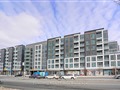
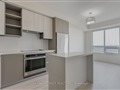
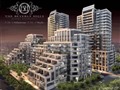
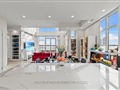
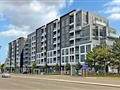
9 Chalmers Rd 110
$678,191
Comparative Market Analysis
Jun 5, 2025
NOT AN ACTIVE LISTING
Historical Performance
| Period | $ Change | % Change |
| 1 Day | +$460 | +0.068% |
| 7 Days | +$300 | +0.044% |
| 30 Days | +$200 | +0.029% |
| 3 Months | -$1,887 | -0.277% |
| 6 Months | +$6,415 | +0.955% |
| 1 Year | -$36.6k | -5.12% |
| 3 Years | +$93.1k | +15.9% |
| 5 Years | +$177k | +35.3% |
| 10 Years | +$374k | +123% |
List My Property
Real Estate Statistics
Financing Solutions
Browsing History
406 Fernleigh Circ, Richmond Hill
2 seconds ago
9 Mocha Cres, Richmond Hill
3 seconds ago
37 Dunsmore Cres, Richmond Hill
4 seconds ago
1 Anvil Crt, Richmond Hill
5 seconds ago
16 Windrow St, Richmond Hill
6 seconds ago
372 Highway 7 Rd 711, Richmond Hill
7 seconds ago
69 Falling River Dr, Richmond Hill
8 seconds ago
Direzze Crt, Richmond Hill
9 seconds ago
27 Cantex Crt, Richmond Hill
10 seconds ago
38 Anvil Crt, Richmond Hill
10 seconds ago
AS SEEN ON


Are You a Licensed Real Estate Agent or Broker?