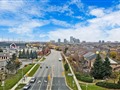
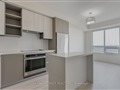
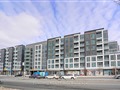
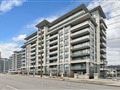
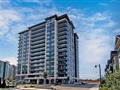
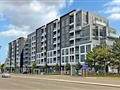
9 Chalmers Rd 209
$457,911
Comparative Market Analysis
Jun 5, 2025
NOT AN ACTIVE LISTING
Historical Performance
| Period | $ Change | % Change |
| 1 Day | +$310 | +0.068% |
| 7 Days | +$203 | +0.044% |
| 30 Days | +$135 | +0.029% |
| 3 Months | -$1,274 | -0.277% |
| 6 Months | +$4,332 | +0.955% |
| 1 Year | -$24.8k | -5.13% |
| 3 Years | +$60.9k | +15.3% |
| 5 Years | +$116k | +33.8% |
| 10 Years | +$250k | +121% |
List My Property
Real Estate Statistics
Financing Solutions
Browsing History
43 Cider Cres, Richmond Hill
1 second ago
57 Chao Cres, Richmond Hill
2 seconds ago
26 Tollbar Crt, Richmond Hill
3 seconds ago
376 Highway 7 Rd 726, Richmond Hill
4 seconds ago
7 Breda Crt, Richmond Hill
5 seconds ago
372 Highway 7 Rd 803, Richmond Hill
7 seconds ago
31 Elmpark Crt, Richmond Hill
8 seconds ago
16 Elmpark Crt, Richmond Hill
9 seconds ago
23 Elmpark Crt, Richmond Hill
10 seconds ago
20 Mcnairn Crt, Richmond Hill
11 seconds ago
AS SEEN ON


Are You a Licensed Real Estate Agent or Broker?