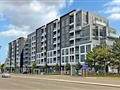
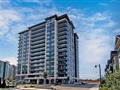
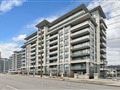
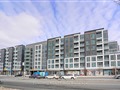
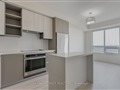
9 Chalmers Rd 213
$702,662
Comparative Market Analysis
Jun 5, 2025
NOT AN ACTIVE LISTING
Historical Performance
| Period | $ Change | % Change |
| 1 Day | +$476 | +0.068% |
| 7 Days | +$311 | +0.044% |
| 30 Days | +$207 | +0.029% |
| 3 Months | -$1,955 | -0.277% |
| 6 Months | +$6,647 | +0.955% |
| 1 Year | -$37.9k | -5.12% |
| 3 Years | +$96.4k | +15.9% |
| 5 Years | +$183k | +35.3% |
| 10 Years | +$388k | +123% |
List My Property
Real Estate Statistics
Financing Solutions
Browsing History
32 Bilbermar Dr, Richmond Hill
1 second ago
37 Pebblelane Crt, Richmond Hill
1 second ago
22 Clarissa Dr 512, Richmond Hill
1 second ago
20 Woodhaven Cres, Richmond Hill
1 second ago
12 Greenbelt Cres, Richmond Hill
2 seconds ago
79 Red Oak Dr, Richmond Hill
2 seconds ago
58 Hearthstone Cres, Richmond Hill
2 seconds ago
53 Fern Valley Cres, Richmond Hill
3 seconds ago
38A Eastdale Cres, Richmond Hill
3 seconds ago
91 Royal Chapin Cres, Richmond Hill
3 seconds ago
AS SEEN ON


Are You a Licensed Real Estate Agent or Broker?